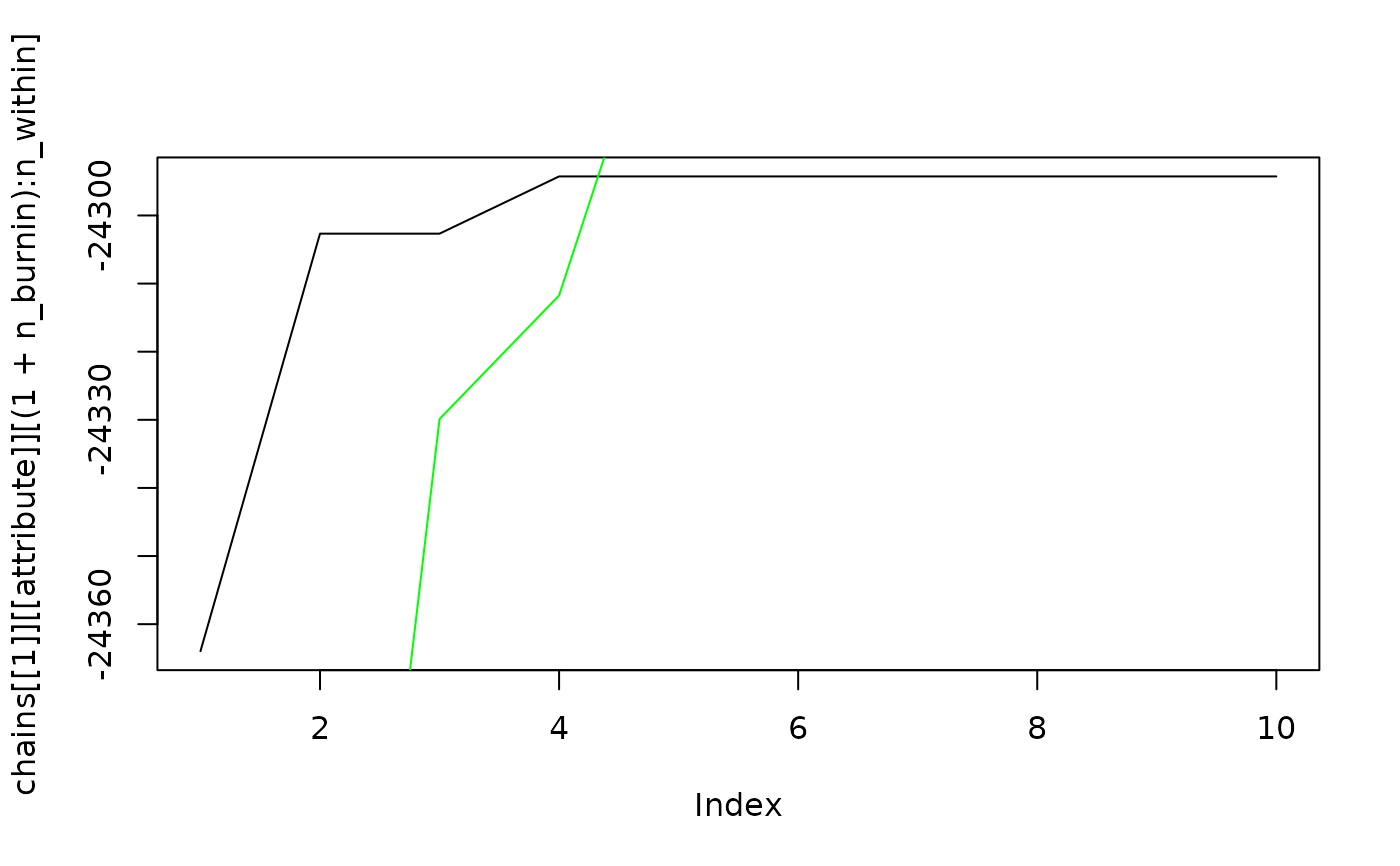
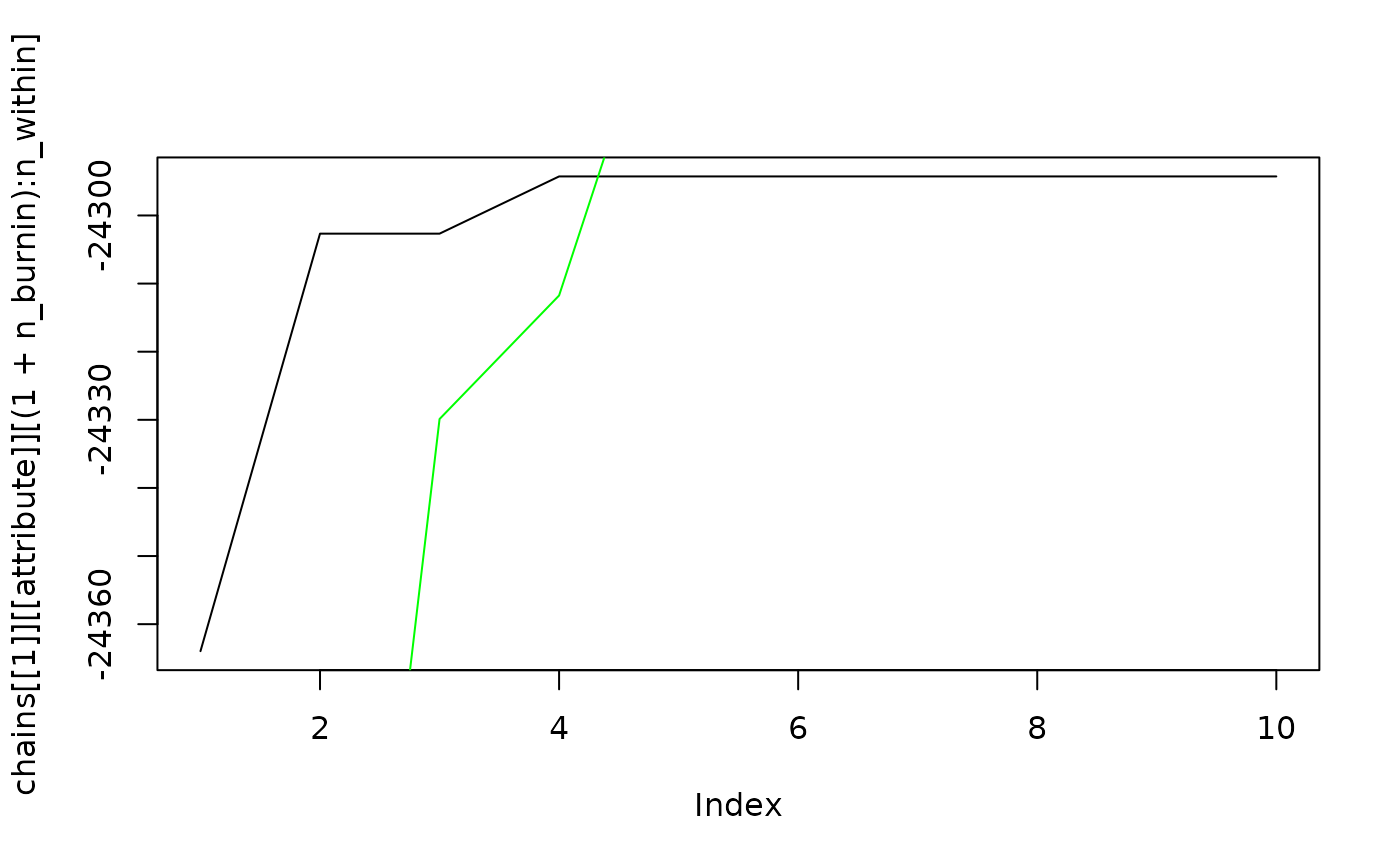
Plot the score trace
Arguments
- chains
MCMC chains.
- attribute
Name of attribute to plot. Default is "log_score".
- n_burnin
Number of steps to remove as burnin.
- same_plot
Whether to plot on the same figure or on multiple figures.
- col
A string representing a color for a single chain or a vector of strings to cycle through for multiple chains.
Value
Depending on the argument 'same_plot', either:
A single 'ggplot' object combining all chains into one plot
A list of 'ggplot' objects, each corresponding to a separate chain
Examples
data <- bnlearn::learning.test
scorer <- CreateScorer(
  scorer = BNLearnScorer,
  data = data
  )
init_state <- InitPartition(colnames(data), scorer)
results <- SampleChains(10, init_state, PartitionMCMC(), scorer)

# Plot partition score trace.
PlotScoreTrace(results)


# Plot DAG score trace.
dag_chains <- PartitiontoDAG(results, scorer)
PlotScoreTrace(dag_chains)
