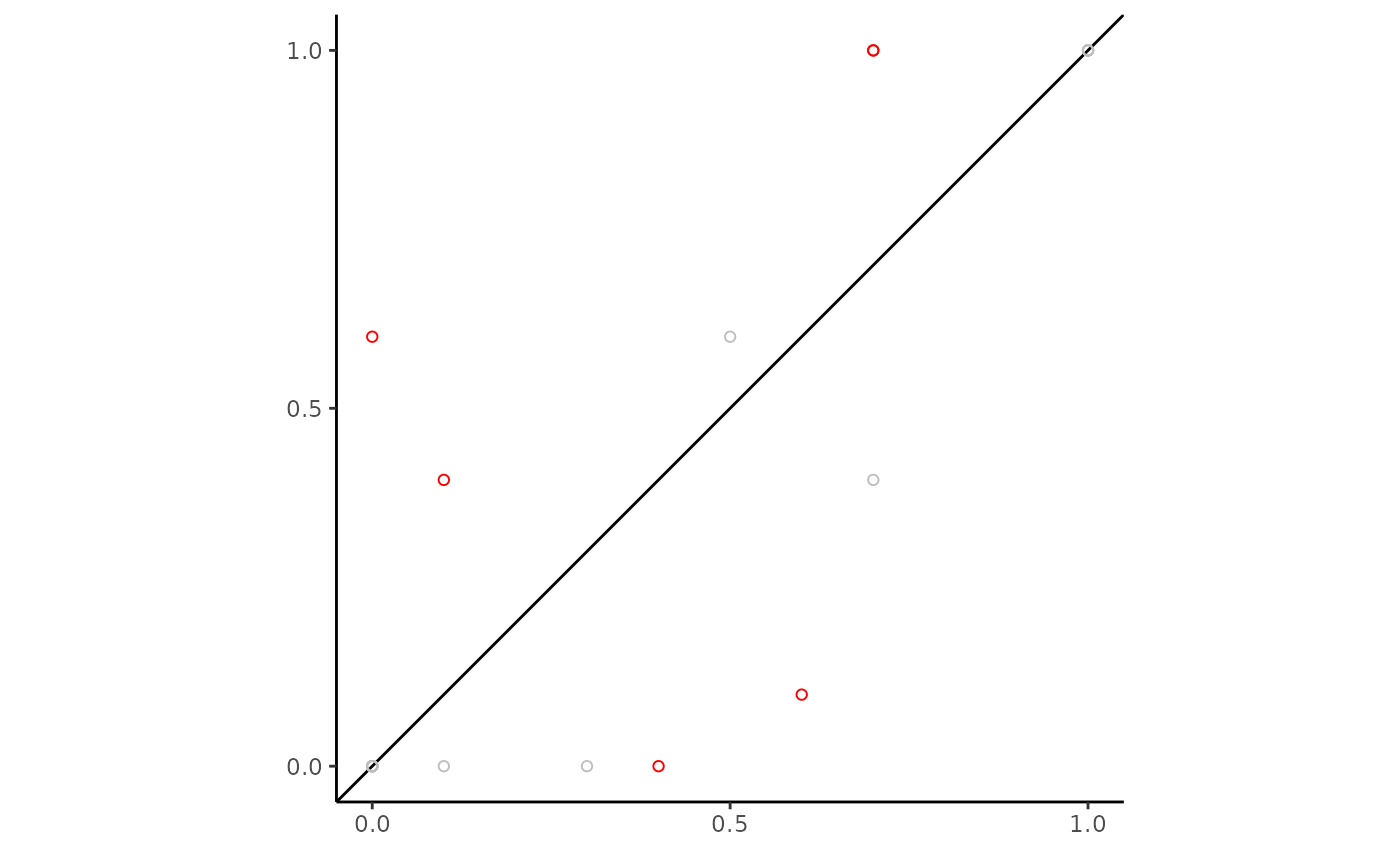
Plot a concordance plot to compare point-estimates for quantities of interest between chains.
Arguments
- x
A list of adjacency matrices representing edge probabilities, a chains object, or a collections object with states as DAGs.
- ...
Additional parameter to send to the appropriate method. This includes 'highlight' (defauled to 0.3) which sets the cutoff difference that is used to highlight the points, and the probability edge estimation 'method' for a cia_collections object.
Examples
data <- bnlearn::learning.test
scorer <- CreateScorer(scorer = BNLearnScorer, data = data)
init_state <- InitPartition(colnames(data), scorer)

results <- SampleChains(10, init_state, PartitionMCMC(), scorer, n_parallel_chains = 2)
dags <- PartitiontoDAG(results, scorer)

p_edge <- CalculateEdgeProbabilities(dags)
PlotConcordance(p_edge)
